The Newscaster/Nature Coast News
PAGE 5 - August 1, 2007
BUDGET SUMMARY
THE PROPOSED OPERATING EXPENDITURES
OF THE SCHOOL BOARD OF LEVY COUNTY ARE 2.92%
MORE THAN LAST YEAR'S TOTAL OPERATING BUDGET
Fiscal Year 2007-08
Proposed Millage Levy:
Local Effort
4.780
Supplemental Discretionary
0.250
Discretionary
0.510
Capital Outlay
2.000
TOTAL MILLAGE: 7.540
ESTIMATED REVENUES GENERAL FUND SPECIAL REVENUE DEBT SERVICE CAPITAL PROJECTS
TOTAL ALL FUNDS
Federal Sources
135,000
4,857,051
4,992,051
State Sources
32,564,052
1,879,151
634,879
3,548,835
38,626,917
Local Sources
13,905,158
760,031
5,900
4,639,219
19,310,308
TOTAL SOURCES
46,604,210
7,496,233
640,779
8,188,054
62,929,276
Transfers In
295,512
662,120
200,000
1,157,632
Fund Balance (July 1, 2007)
2,294,292
143,811
113,880
2,290,363
4,842,346
TOTAL REVENUES & BALANCES 49,194,014
7,640,044
1,416,779
10,678,417
68,929,254
EXPENDITURES
Instruction
25,912,663
3,366,769
29,279,432
Pupil Personnel Services
2,238,582
204,935
2,443,517
Instructional Media Services
949,724
12,326
962,050
Instructional & Curriculum Services 1,125,101
508,522
1,633,623
Instructional Staff Training
180,514
324,654
505,168
Instructional Related Technology
109,604
179,868
289,472
Board of Education
252,406
252,406
General Administration
1,177,124
97,332
1,274,456
School Administration
3,234,809
803
3,235,612
Facilities Acquisition & Construction 275,584
8,566,297
8,841,881
Fiscal Services
468,410
468,410
Food Service
2,639,004
2,639,004
Central Services
390,813
27,242
418,055
Pupil Transportation Service
3,825,138
134,600
3,959,738
Operation of Plant
3,826,982
3,826,982
Maintenance of Plant
1,067,222
1,067,222
Administrative Technology
572,648
572,648
Community Services
5,795
5,795
Debt Service
1,003,583
1,003,583
TOTAL EXPENDITURES
45,613,119
7,496,055
1,003,583
8,566,297
62,679,054
TRANSFERS OUT
295,512
862,120
1,157,632
Fund Balance (June 30, 2008) 3,580,895
143,989
117,684
1,250,000
5,092,568
49,194,014
7,640,044
1,416,779
10,678,417
68,929,254
TOTAL EXPENDITURES,
TRANSFERS & BALANCES
THE TENTATIVE, ADOPTED, AND/OR FINAL BUDGETS ARE ON FILE IN THE OFFICE OF THE ABOVE MENTIONED TAXING AUTHORITY AS A PUBLIC RECORD.
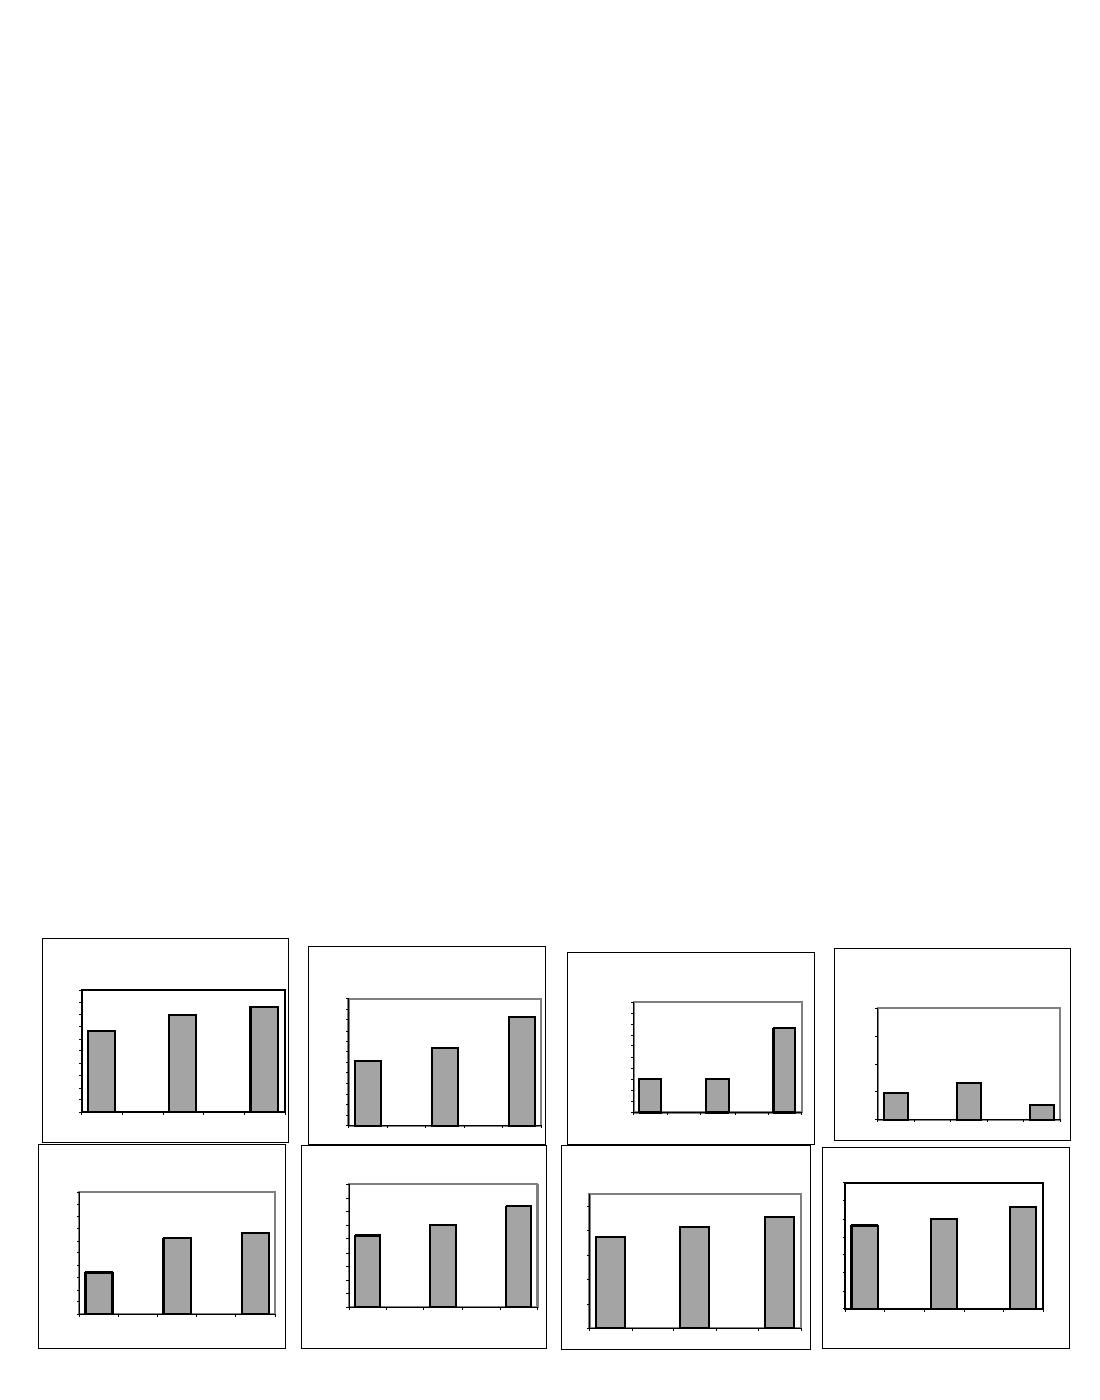
Historical Summary Of Financial And Demographic Data Ten Year Summary, 1996-97, 2001-02, And 2006-07 (Estimated)
Total Revenues
Total Current Operating
Capital Projects Revenues
Debt Service Revenues (less
(Federal, State, Local)
Revenues
transfers in)
$51,000,000
$44,264,542
$60,000,000
$10,000,000
$46,000,000
$40,775,763
$2,000,000
$51,193,705
$55,000,000
$9,000,000
$41,000,000
$7,667,740
$50,000,000
$8,000,000
$34,209,009
$36,000,000
$45,000,000
$7,000,000
$1,500,000
$37,070,910
$31,000,000
$40,000,000
$6,000,000
$30,706,476
$26,000,000
$35,000,000
$5,000,000
$30,000,000
$21,000,000
$4,000,000 $3,021,922
$3,049,920
$1,000,000
$654,934
$25,000,000
$16,000,000
$3,000,000
$480,612
$20,000,000
$11,000,000
$2,000,000
$500,000
$269,553
$15,000,000
$1,000,000
$6,000,000
$10,000,000
$0
$1,000,000
$5,000,000
$0
1996-97
2001-02
2006-07
1996-
2001-
2006-
$0
1996-97
2001-02
2006-07
97
02
07
1996-97
2001-02
2006-07
Current Operating Revenues
Total Num ber of
Total Num ber of Em ployees
Num ber of Unw eighted FTE
per Unw eighted FTE
Instructional Em ployees
700
$9,000
6,500
$7,361
565
$8,000
600
6,400
1000
915
495
$7,000
$6,055
464
6,300
831
500
6,165.21
$5,253
$6,000
6,122.85
748
6,200
800
400
$5,000
6,100
`
6,000
$4,000
300
600
5,900
5,845.80
$3,000
200
5,800
$2,000
400
5,700
100
$1,000
5,600
200
$0
0
5,500
1996-97
2001-02
2006-07
1996-97
2001-02
2006-07
1996-97
2001-02
2006-07
0
Cino0L6a07 n Care Service
w
1996-97
2001-02
2 0 -